GDB Debugger Tips
English · Русский
Introduction
Lazarus comes with GDB as default debugger. From Lazarus 2.0 onwards, this default has changed to LLDB on MacOs.
- This page is for Lazarus 1.0 and newer. For older versions see [ previous version of this page]
- Note on GDB 7.5: GDB 7.5 is not supported by the released 1.0. Fixes to support it were made in 1.1.
See also
Setup (GDB and LLDB)
To get the best possible results, you must ensure that your IDE and Project are both correctly configured.
See Debugger Setup how to set up the IDE and your project in order to use the debugger.
Other
General
Debug Info Type (GDB and LLDB)
Note: Those setting apply only to the project or package to which they are set. If changing settings in either project or package options, it should be ensured that this is done for all packages and the project.
Otherwise your project will have mixed debug info, which can lead to a degraded debug experience.
The setting can be applied to project and packages using Additions and Overrides
Note: When compiling 32Bit apps (native or cross) FPC defaults to "Stabs" (At least on some OS). It is recommended to change your configuration to "Dwarf".
For 64 bit applications, FPC supports only "Dwarf". (Older FPC also support "Stabs", but that is not recommended)
Stabs (only GDB)
-g or -gs
You should only use if your gdb version does not support dwarf. There are very few other cases where you need it.
You may need it with "var param" (param by ref) procedure foo(var a: integer); However the IDE deals with this in 99% of all cases.
The LLDB based debugger does not support Stabs
Dwarf (GDB and LLDB)
Dwarf 2 (-gw)
This sets the format to Dwarf2. This is the most basic dwarf setting.
Dwarf 2 with sets (-gw -godwarfsets)
This setting adds the ability to inspect sets: "type TFoo=set of (a,b,c);". This is borrowed from the Dwarf 3 specs, but supported by most versions of GDB (any GDB from version 7 upwards should do).
This is the recommended setting.Dwarf 3 (-gw3)
Dwarf 3 can encode additional info for some types (such as strings and arrays). It also preserves the case of identifiers in the debug info.
However there are still issues with the produced debug info. Some info may be incorrectly encoded, and other is not understood by GDB. In some cases this can lead to gdb crashing. This setting can be used, when using the FpDebug based debugger (add on package for the IDE)
Differences
This list is in no way complete:
- dwarf allows some properties (those directly mapped to a field)
- stabs (and modern gdb) can do -gp (preserve the case of symbols, instead of getting the all caps stuff).
- stabs has problems with some class type casts. The IDE fixes that in some cases. (Only affects gdb 7.0 and up) 1
Inspecting data types (Watch/Hint)
Strings
GDB does not know the Pascal string data type. The type information GDB returns does not currently allow for the IDE to differentiate between a PChar (index is 0 based) or a String (index is 1 based).
As a Result "mystring[10]" could be the 10th char in a string, or 11th in a PChar.
Because the IDE cannot be sure which one applies, it will show both. The 2 results will be prefixed String/PChar.
Properties
Currently the debugger does not support any method execution. Therefore only properties that refer directly to a variable can be inspected. (This only works if using dwarf)
TFoo = Class
private
  FBar: Integer;
  function GetValue: Integer;
public
  property Bar: Integer read FBar;        // Can be inspected (if Dwarf is used)
  property Value: Integer read GetValue;  // Can *not* be inspected
end;
Nested Procedures / Function
procedure SomeObject.Outer(NumText: string);
var
  OuterVarInScope: Integer;

procedure Nested;
var
  I: Integer;
begin
  WriteLn(OuterVarInScope);
end;

var
  OuterVarOutsideScope: Integer;

begin
  Nested;
end;
If you step into "Nested", then the IDE allows you to inspect variables from both stack frames.
This is you can inspect: I, OuterVarInScope, NumText (without having to change the current stack frame, in the stack window)
However there are some caveats:
You can also inspect: OuterVarOutsideScope. That is against Pascal scoping rules. This only matters if you have several nested levels, and they all contain a variable of the same name, but the Pascal scoping would hide the variable from the middle frame. Then you get to see the wrong value.
You cannot evaluate statements across the 2 frames: "OuterVarnScope-I" does not work.
Warning: You may see a wrong value. If there is in any other unit a global (or otherwise visible to GDB scoping rules) variable, with the same name as the local var from the outer frame, then that global var will be shown. There is no warning for that. The safe way is to explicitly select the outer stack frame in which the local var is defined, and check the value.
Arrays
array [x..y] of Integer;shows as chars, instead of int. Only gdb 7.2 or up seems to handle it correctly.
Additionally there may be issues when using arrays of (unnamed) records.
Dynamic Arrays will only show a limited amount of their data. As of Lazarus 1.1 the limit can be specified.
If Watches/Hint values are not displaying correctly disable REGVARS. Set -OoNOREGVAR in "Custom Options".
Specifying GDB disassembly flavor
GDB allows one to specify the assembly flavor (intel or AT&T style) to be used when displaying assembly code. If one wants to change to a specific flavor this can be changed in the AssemblerStyle property in Lazarus's debugger options for GDB (feature available from Lazarus 2.0). Alternatively (and the only way to achieve this from inside Lazarus in older versions before Lazarus 2.0) one can specify this option by passing the set disassembly-flavor instruction to Debugger_Startup_options. Several syntax variations can be used (depending on GDB version), a few variations are shown below:
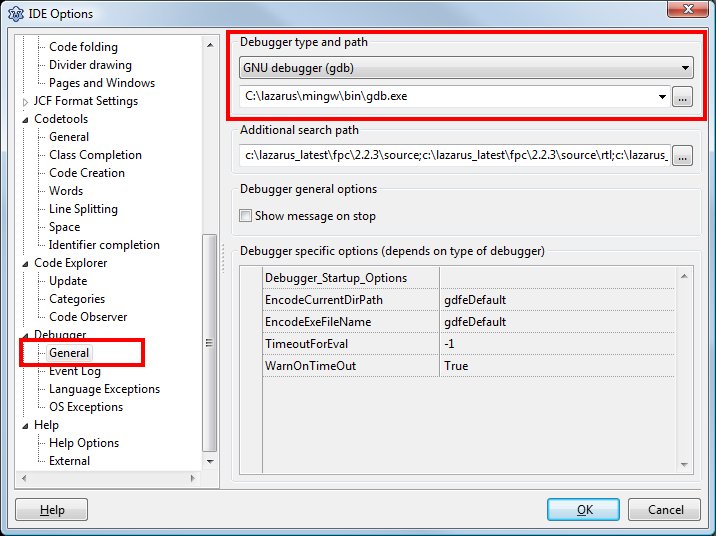
 -ex "set disassembly-flavor intel"
 --eval-command="set disassembly-flavor intel"
 -eval-command="set disassembly-flavor intel"
 --eval-command "set disassembly-flavor intel"
Note that it may be necessary to reset the debugger (Run | Reset Debugger) before GDB will load with the new setting.
Windows
Environment and Unicode / None-Latin based locale
GDB in combination with Lazarus can have issues, if your environment (such as Username, or PATH, or ...) contain none Latin chars.
This is not an issue with any particular GDB version. Rather it depends on how GDB was build. To work correctly under Lazarus GDB needs to have been build using Cygwin.
There are several builds available provided by the Lazarus team. Some of them are build with Cygwin. For 64bit: https://sourceforge.net/projects/lazarus/files/Lazarus%20Windows%2064%20bits/Alternative%20GDB/
For 32bit the builds have not yet been tested. https://sourceforge.net/projects/lazarus/files/Lazarus%20Windows%2032%20bits/Alternative%20GDB/
Console output for GUI application
On Windows, the IDE does not have the "Debugger - Console output" window. This is because console applications open their own console window. GUI applications by default have no console. In order to have a console for a GUI application, the compiler settings must be changed (Project options / Compiler Options / Config and Target / Win32 Gui Application: -WC / -WG)
Debugging applications with Administrative privileges
On Windows Vista+, in Project Options setting the manifest file permissions for the program to "as Administrator" will run the program with Administrator privileges. If your IDE is not running as Administrator, debugging will appear to start ok, the program will show in the tasklist, but its GUI will not show.
So please be aware that you have to match privilege level between the IDE (and gdb) and the applicationt to be debugged.
Win 64 bit
- Requires Lazarus 1.0+ (with FPC 2.6+)
- Advised to use dwarf
Using 32 bit Lazarus on 64 bit Windows
Alternatively it is possible to debug applications as 32 bit applications (using the 32bit version of gdb). Once successfully debugged:
- the app can then be cross-compiled to 64 bit, or
- a 2nd Lazarus installation can be used (using a different configuration --primary-config-path option from the 32 bit Lazarus)
When installing the 32 bit Lazarus, ensure you change configuration so the correct 32 bit FPC and GDB are used.
More Win 64 bit problems and solutions
See also http://forum.lazarus.freepascal.org/index.php/topic,13188.0/topicseen.html
Win CE
Debugger does not find any source files
Menu: "Tools" Page: "Debugger"/"Generic" Field: "Additional search path"
Put your the drive letter of your project directory in this field.
Linux
Known Problems
- There might be issues on at least some CPUs when using an old version of gdb (e.g. SPARC, with gdb 6.4 as supplied by Debian "Etch"). In particular, background threads might lock up even if the program appears to run correctly standalone.
- If your program appears to lock up at start up, go to Tools / Options / Debugger / General and set DisableLoadSymbolsForLibraries=True
macOS
With the release of macOS 10.14 (Mojave) in 2018, gdb was replaced by lldb', and is no longer supported.
This section is a first approach to collect information about known issues and workarounds. The information provided here depends a lot on feedback from macOS users.
From Lazarus 2.0 onwards the IDE has an LLDB based debugger. The GDB based debugger can also be used, but requires a lot of work building and code-signing the gdb binary and is not supported.
Known Problems (GDB)
Debugging 32 bit app on 64 bit architecture
It is possible and maybe sometime necessary to debug a 32 bit exe on a 64 bit system.
This is only possible with Lazarus 0.9.29 rev 28640 and up.
TimeOuts (64 Bit only)
It appears that certain commands are not correctly (or incompletely) processed by gdb 6.3.50. Normally GDB finishes each command with a "<gdb>" prompt for the next command. But the version provided by apple sometimes fails to do this. In this case the IDE will have to use a timeout to avoid waiting forever.
This has been observed with:
- Certain Watch expressions (at least if the watched variable was not available in the current selected function)
- Handling an Exception
- Inserting breakpoints (past unit end / none code location)
It cannot be guaranteed:
- that GDB will not later return some results from such a command
- that GDB's internal state is still valid
The prompt displayed for timeouts can be switched off in the debugger config.
Warn On Timeout
True/False. Auto continue, after a timeout, do not show a warning.
TimeOutForEval
Set in milliseconds, how long until a timeout detection is triggered (the detection itself may take some more time.)
You may need to "RESET" the debugger after those changes are made
More info see here:
An alternative solution seems to be to use a newer version of GDB (see below).
Hardware exceptions under macOS
When a hardware exception occurs under macOS, such as an invalid pointer access (SIGSEGV) or an integer division-by-zero on Intel processors, the debugger will catch this exception at the Mach level. Normally, the system translates these Mach exceptions into Unix-style signals where the FPC run time library handles them. The debugger is however unable to propagate Mach exceptions in this way.
The practical upshot is that it is impossible under macOS to continue a program in the debugger once a hardware exception has been triggered. This is not FPC-specific, and cannot be fixed by us.
Using Alternative Debuggers (GDB)
You can install GDB 7.1 (or later) using MacPorts, fink or homebrew.
The following observations have been made:
- GDB 7.1 seems to have issues with the stabs debug info from fpc.
Make sure you select "generate dwarf debug information (-gw)" on the linking tab of the project options
Watch out for the linker warnings about "unknown stabs"
If you still have problems ensure that no code at all, is compiled with stabs. Your LCL may contain stabs, and this will end up in your app, even if you compile the app with -gw. So you may have to recompile your LCL with -gw (or without any debug info). Same for any other unit, package, rtl, .... that may have stabs
Even with those rules followed, GDB does not always work with fpc compiled apps.
Those observations may be incomplete or wrong, please update them, if you have more information.
Lazarus Version 1.0 to 1.0.12
In the debugger options configure
 EncodeCurrentDirPath = gdfeNone
 EncodeExeFilename = gdfeNone
And you must use "run param" to specify the actual executable inside the app-bundle ( project.app/Content/MacOS/project or similar)
In Lazarus Version 1.0.14 to 1.2 and up those steps should no longer be required.
Xcode 5
Since Mavericks 10.9, Xcode 5 no longer installs gdb by default and not globally.
- For 10.9 you can install an old Xcode 4 in parallel. This is not supported by Apple, so it might break with one of the next versions.
- You can compile and install gdb. See GDB on OS X Mavericks or newer and Xcode 5 or newer.
Please see issue 25157 on mantis
- http://forum.lazarus.freepascal.org/index.php/topic,22529.0.html - about installing Xcode 4.3
- http://forum.lazarus.freepascal.org/index.php/topic,22328.0.html - install gdb
Thread "[Lazarus] Help: macOS Problems" on
- http://lists.lazarus.freepascal.org/pipermail/lazarus/2013-November/thread.html#84126
- http://lists.lazarus.freepascal.org/pipermail/lazarus/2013-October/thread.html#84095
Frozen UI with GDB
To start a program from the shell you need to run "open <program1>.app", direct access to ./program1 will not give you access to the UI. To get gdb working from inside your IDE you have to specify this path as run parameter. Choose from menu Run > Run parameter and enter the full path at host application. For instance, /User/<yourid>/sources/myproject/project1.app/Content/MacOS/project1
Links
- macOS comes with a lot of useful tools for debugging and profiling. Just start /Developer/Applications/Instruments.app and try them out.
FreeBSD
FreeBSD 11
The system-provided gdb is ancient (version 6.1.1 in FreeBSD 11.4) and does not work well with Lazarus.
You can install a newer gdb from the ports tree, e.g.
cd /usr/ports/devel/gdb
make -DBATCH install clean
The new gdb is located in "/usr/local/bin/gdb".
FreeBSD 12
The system-provided gdb is ancient (version 6.1.1 in FreeBSD 12.3) and it does not work well with Lazarus.
You can install a newer gdb from the ports tree, e.g.
cd /usr/ports/devel/gdb
make -DBATCH install clean
The new gdb is located in "/usr/local/bin/gdb".
It may need the following project option ("Project Options" dialog):
- "Use external debug symbols file" is off
FreeBSD 13
FreeBSD 13.0 has removed the ancient gdb from the base system and replaced it with lldb.
You can still install a recent gdb from the ports tree.
Using a translated GDB (non-English responses from GDB)
- This applies only to Lazarus before 1.2 or before 1.0.14.
This is no longer needed.
The IDE expects responses in English. If GDB is translated this may affect how well the IDE can use it.
In many cases it will still work, but with limits, such as:
- No Message or Class for exceptions
- No live update of threads, while app is running
- Debugger error reported, after the app is stopped (at end of debugging)
- other ...
Please read the entire thread: [http://forum.lazarus.freepascal.org/index.php/topic,20756.msg120720 http://forum.lazarus.freepascal.org/index.php/topic,20756.msg120720](/wiki/Http://forum.lazarus.freepascal.org/index.php/topic%2C20756.msg120720_http://forum.lazarus.freepascal.org/index.php/topic%2C20756.msg120720)
Try to run lazarus with
 export LANG=en_US.UTF-8
 lazarus
Known Problems / Errors reported by the IDE
Message
OS
Description
During startup program exited normally
All
In rare cases the IDE displays the message "During startup program exited normally". This message appears when the debugged application is closed. If this happens no breakpoints in the app will have been triggered, and the app will have run as if no debugger was present.
This error can happen for various reasons. There are at least 2 known:
- certain position independent exe (PIE) : GDB fails to relocate certain breakpoints that Lazarus uses to start the exe (this is before any user breakpoints are set)
- certain dll/so libraries, that define the same symbols as the main exe.
There may be more. The 2nd only happens on repeated runs of the debugger.
The IDE tries to work around those, but it does not always succeed. It is likely that in cases where it currently fails, this must be worked around by user set config (see below).
Even if you can work around, please consider to send a logfile: #Log_info_for_debug_session
Ways to work around: (all on the options / debugger page)
- In case 2 only: #gdb.exe_has_stopped_working
Lazarus 1.2.2 and before
go to the debugger options and in the field "debugger_startup_options" enter:
--eval-command="set auto-solib-add off"
Lazarus 1.2.4 and higher
go to the debugger options and set the field "DisableLoadSymbolsForLibraries" to "True"
This can only be used, if you do not debug within libraries (if you have not written your own lib)
- In Case 2 only: Check "reset debugger after each run"
It will add a very slight increase to the time it takes to start the debugger, as gdb must be reloaded each time.
- In all cases:
Try any of the values available for "InternalStartBreak" (in the property grid of the options)
SIGFPE
All
SIGFPE is a floating point unit exception.
Source: http://forum.lazarus.freepascal.org/index.php/topic,21586.0.html forum thread
SIGFPE exceptions are raised on the next FPU instruction; therefore the error line you get from Lazarus may be off/incorrect.
Delphi, and thus Freepascal, have a non standard FPEMask. A lot of C libraries don't use exceptions to check FPU problems but inspect the FPU status.
Workaround: try changing the mask with SetExceptionMask as early as possible in your program:
uses  math;
...
 SetExceptionMask([exInvalidOp, exDenormalized, exZeroDivide,
                   exOverflow, exUnderflow, exPrecision])
If you think there is something wrong in the FPC code, you can use the $SAFEFPUEXCEPTIONS directive. This will add a FWAIT after every store of a FPU value to memory. Most FPC float and double operations end with storing the result somewhere in memory so the outcome is that the debugger stops on the correct FPC line. FWAIT is a nop for the FPU but will cause an exception to be raised immediately instead of somewhere down your code. It is not done per default because it slows down floating point operations a lot.
Error 193 (Error creating process / Exe not found)
Windows
For details see here. This issue has been observed under Win XP and appears to be caused by Windows itself. The issue occurs if the path to your app has a space, and a 2nd path/file exists, with a name identical to the part of the path before the space, e.g.:
Your app: C:\test folder\project1.exe
Some file: C:\test
SigSegV - even with new, empty application
Windows
Note
In most cases SigSegV is simply an error in your code.
The following applies only, if you get a SigSegv, even with a new empty application (empty form, and no modifications made to unit1).
A SigSegV sometimes can be caused by an incompatibility between GDB and some other products. It is not known if this is a GDB issue or caused by the other product. There is no indication that any of the products listed is in any way at fault. The information provided may only apply to some versions of the named products:
Comodo firewall
http://forum.lazarus.freepascal.org/index.php/topic,7065.msg60621.html#msg60621
BitDefender
enable game mode
SigSegV - and continue debugging
Windows, Mac
http://sourceware.org/bugzilla/show_bug.cgi?id=10004
http://forum.lazarus.freepascal.org/index.php/topic,18121.msg101798.html#msg101798
On Windows Open/Save/File or System Dialog cause gdb to crash
See next entry "gdb.exe has stopped working"
Or download the "alternative GDB" 7.7.1 (Win32) from the Lazarus SourceForge site.
"Step over" steps into function (Win 64)
Windows 64
Sometimes pressing F8 does not step over a function, but steps into it.
It is possible to continue with F8, and sometimes GDB will step back into the calling function, after 1 or 2 further steps (stepping over the remainder of the function).
In Lazarus 2.0 a workaround was added, but needs to be enabled. Go to Tools > Options > Debugger and enable (in the property grid) "FixIncorrectStepOver".
gdb.exe has stopped working / SigSegv with Open/Close Dlg
Windows
GDB itself has crashed. This will be due to a bug in gdb, and may not be fixable in Lazarus. Still it may be worth submitting info (see section "Reporting Bugs" below). Maybe Lazarus can avoid calling the failing function.
There is one already known situation. GDB (6.6 to 7.4 (latest at the time of testing)) may crash while your app is being started, or right after your app stopped. This happen while the libraries (DLL) for your app are loaded (watch the "Debug output" window).
Lazarus 1.2.2 and before
go to the debugger options and in the field "debugger_startup_options" enter:
--eval-command="set auto-solib-add off"
Lazarus 1.2.4 and higher
go to the debugger options and set the field "DisableLoadSymbolsForLibraries" to "True"
This can only be used, if you do not debug within libraries (if you have not written your own lib) 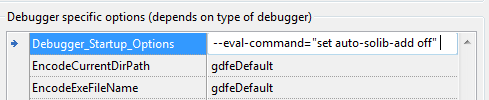
internal-error: clear_dangling_display_expressions
Windows, maybe other
At the end of the debug session, the debugger reports:
internal-error: clear_dangling_display_expressions:
Assertion `objfile->pspace == solib->pspace' failed.
This is an error in gdb, and sometimes solved by
Lazarus 1.2.2 and before
go to the debugger options and in the field "debugger_startup_options" enter:
--eval-command="set auto-solib-add off"
Lazarus 1.2.4 and higher
go to the debugger options and set the field "DisableLoadSymbolsForLibraries" to "True"
This can only be used, if you do not debug within libraries (if you have not written your own lib)
"PC register is not available" ("SuspendThread failed. (winerr 5)")
Windows
GDB may fail with this message. This is due to http://sourceware.org/bugzilla/show_bug.cgi?id=14018 If you get this issue you may want to downgrade to GDB 7.2
Cannot insert breakpoint
All
For breakpoints with negative numbers Please see: http://forum.lazarus.freepascal.org/index.php/topic,10317.msg121818.html#msg121818
You may also want to try:
Lazarus 1.2.2 and before
go to the debugger options and in the field "debugger_startup_options" enter:
--eval-command="set auto-solib-add off"
Lazarus 1.2.4 and higher
go to the debugger options and set the field "DisableLoadSymbolsForLibraries" to "True"
This can only be used, if you do not debug within libraries (if you have not written your own lib)
For breakpoints with positive numbers This may happen due to incorrect Debugger Setup. Ensure smart linking is disabled. It usually means that the breakpoint is in a procedure that is not called, and not included in your exe.
On Windows, if it happens despite correct setup, then add -Xe (external linker) to the custom options.
Reporting Bugs
- Did you verify your Debugger Setup?
- Did you try Dwarf and Stabs
Check existing Reports
Please check each of the following links
- Search Mantis for category "debugger"
- Search Mantis for text "debugger"
- Search Mantis for text "gdb"
- Search Mantis for text "dwarf"
- Search Mantis for text "stabs"
Bugs in GDB
Description
OS
GDB Version(s)
Reference
win64 crash with bad dwarf2 symbols
win64
GDB 7.4 (maybe higher)
http://sourceware.org/bugzilla/show_bug.cgi?id=14014
Debuggee doesn't see environment variables set with set environment
win
Solved in GDB 7.4
http://sourceware.org/bugzilla/show_bug.cgi?id=10989
Win32 fails to continue with "winerr 5" (pc register not available)
apparently not present in 7.0 to 7.2
win
GDB 7.3 and up (maybe 6.x too)
Appears to be fixed in 7.7.1
http://sourceware.org/bugzilla/show_bug.cgi?id=14018
Wrong array index with dwarf
*
GDB 7.3 to 7.5 (maybe 7.6.0)
fixed in 7.6.1
http://sourceware.org/bugzilla/show_bug.cgi?id=15102
GDB crashes, if trying to inspect or watch resourcestrings
only tested on win32, not known for other platforms only, if using dwarf
*
GDB 7.0 to 7.2.xx
Records (especially: pointer to record) may be mistaken for classes/objects
The data/values appear to be displayed correct / further tests pending
This also affect the ability to inspect shortstring
You can workaround this by manually typecasting.
*
GDB 7.6.1 and up (tested and failing up to GDB 8.1)
https://sourceware.org/bugzilla/show_bug.cgi?id=16016
Object variables (Members) of the current methods class (self.xxx) cannot be watched/inspected
To work around use upper case or prefix with self.
*
GDB 7.7 up to 7.9.0 (incl)
Workaround present in Lazarus 1.4 and up
https://sourceware.org/bugzilla/show_bug.cgi?id=17835
gdb cannot continue after SIGFPE or SIGSEGV happen on windows
win
*
https://sourceware.org/bugzilla/show_bug.cgi?id=10004
GDB truncates values for "const x = qword(...)"
Win 64 bit
maybe others
Fixed in GDB 7.7 and up, maybe fibed between 7.3 and 7.7
GDB error for inspecting interfaces (IUnknown etc)
DWARF 3
https://sourceware.org/bugzilla/show_bug.cgi?id=25101
GDB can not display structures (e.g. class) with dyn array inside
DWARF 3
https://sourceware.org/bugzilla/show_bug.cgi?id=25102
GDB crash on ^AnsiString
DWARF 3
https://sourceware.org/bugzilla/show_bug.cgi?id=25103
Issues with GDB 7.5.9 or 7.6
There are various reports (not confirmed) for different platforms about crashes in gdb 7.5.9 or 7.6.
It is highly recommended not to use those versions.
- http://bugs.freepascal.org/view.php?id=24401
- http://forum.lazarus.freepascal.org/index.php/topic,20756.msg120842.html#msg120842
- http://sourceware.org/bugzilla/show_bug.cgi?id=15453
Create a new Report (GDB and LLDB)
If you have at any time in the past updated, changed, reinstalled your Lazarus then please check the "Options" dialog ("Environment" or "Tools" Menu) for the version of GDB and FPC used. They may still point to old settings.
Basic Information
- Your Operating system and Version
- Your CPU (Intel, Power, ...) 32 or 64 bit
- Version of
- Lazarus (Latest Release or SVN revision) (Include setting used to recompile LCL, packages or IDE (if a custom compile Lazarus is used))
- FPC, if different from default. Please check the "Options" dialog ("Environment" or "Tools" Menu)
- GDB, please check the "Options" dialog ("Environment" or "Tools" Menu)
- Compiler Settings: (Menu: "Project", "Project Options", indicate all settings you used )
- Page "Code generation"
Optimization settings (-O???): Level (-O1 / ...) Other (-OR -Ou -Os) (Please always test with all optimizations disabled, and -O1)
Log info for debug session
Start Lazarus with the following options:
--debug-log=LOG_FILE --debug-enable=DBG_CMD_ECHO,DBG_STATE,DBG_DATA_MONITORS,DBGMI_QUEUE_DEBUG,DBGMI_TYPE_INFO,DBG_ERRORS:;On Windows: you need to create a shortcut to the Lazarus exe (like the one on Desktop) and edit it's properties. Add " --debug-log=C:\laz.log --debug-enable=..." to the command line.
:;On Linux: start Lazarus from a shell and append " --debug-log=/home/yourname/laz.log --debug-enable=..." to the command line
:;On Mac/OSX:start Lazarus from a shell /path/to/lazarus/lazarus.app/Contents/MacOS/lazarus --debug-log=/path/to/yourfiles/laz.log --debug-enable=...
Attach the log file after reproducing the error.
If you cannot generate a log file, you may try to open the "Debug output" window (from menu "View" -> "Ide Internals").You must open this before you run your app (F9). And then run your app. Once the error occurs, copy, zip, and attach the content of the "debug output" window.
Running the test-case
If you run a different version of GDB you may want to run the test case. Please note, that not all tests have yet the correct expectations for each possible setup. Therefore some tests may fail on some systems.
The debugger test are in the directory:
- Lazarus 1.2.x: debugger\test\Gdbmi\
- Lazarus 1.3 and up: components\lazdebuggergdbmi\test\
In the below the 1.3 path is used. If using 1.2.x substitute as appropriate.
One time setup
Create directory components\lazdebuggergdbmi\test\Logs: Optional, but helps keeping test result in one place
Create config files: in components\lazdebuggergdbmi\test\
copy fpclist.txt.sample to fpclist.txt
copy gdblist.txt.sample to gdblist.txt
open the 2 txt files and edit the path to fpc/gdb, also edit the version (the test may run different test, for different versions). It is possible to specify more than one gdb/fpc
Running the test
- Open project: components\lazdebuggergdbmi\test\TestGdbmi.lpi
- Lazarus 1.2.x only: Rebuild the IDE with option "Clean" (Menu Tools: "Configure build IDE" / Restart is not needed). If this is skipped, compilation of the project may fail. Once compilation failed, ALL .ppu/.o files in debugger\test must be deleted by hand.
- Run the project (If a test failed, you may have to delete *.exe files in components\lazdebuggergdbmi\test\TestApps
See also Lazarus Debugger Implementation#Testcases (Backend)
Links
External Links
Experimental Debuggers in Pascal
Those are work in progress:
- http://sourceforge.net/projects/duby/
- https://github.com/graemeg/fpdebug
- FpDebug in Lazarus/components/fpdebug and debugger/components/fpgdbmidebugger blog FpGdbmiDebugger, LazDebuggerFpLldb and LazDebuggerFP
- http://forum.lazarus.freepascal.org/index.php/topic,22252.0.html
Related forum topics
From the Free Pascal wiki, page "GDB Debugger Tips", as it stood on 2022-05-28 after a change by Trev, out of the wiki's dump of 2024-05-26. Copyright stays with the author who wrote it, according to the old wiki's Licensing page. If you have concerns about this material, message the admin.